Six graphs to understand the migration phenomenon
Every day, thousands of refugees and migrants are crossing European borders, searching for protection or a better life. It is posing an unprecedented challenge for the European Union, which has tried for months to reach agreement on a unified strategy for responding.
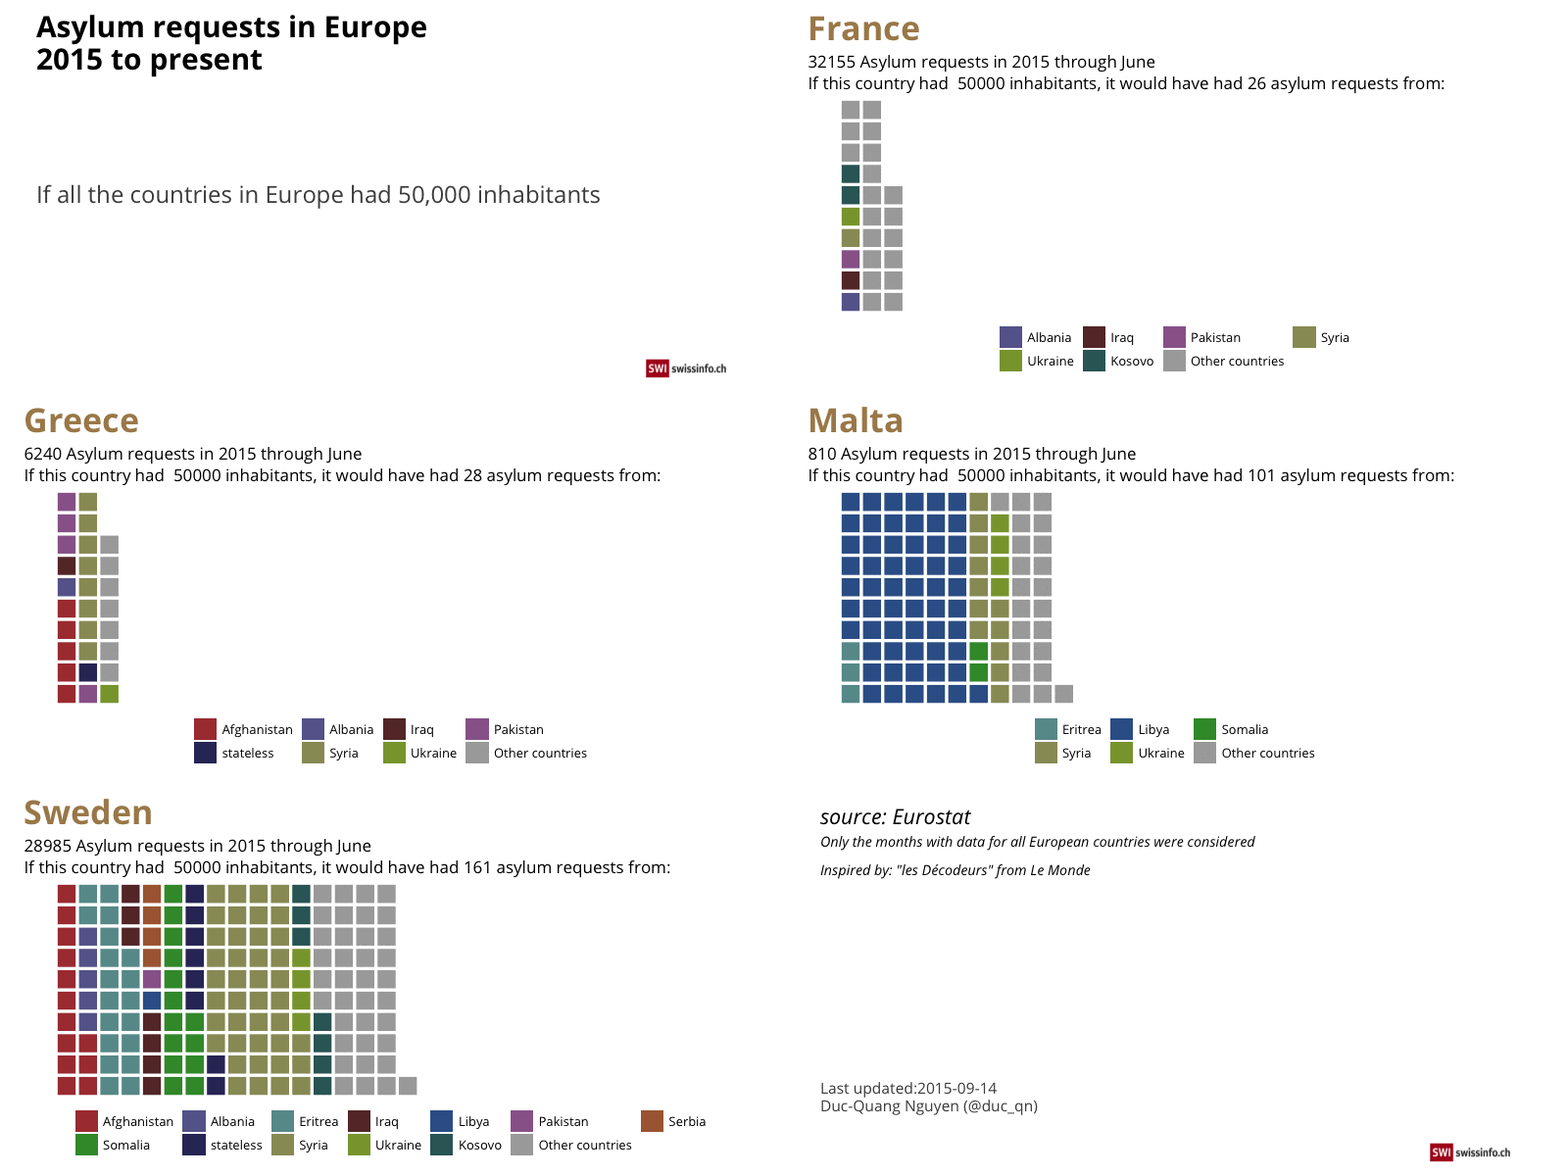
Which countries are the most affected? What might happen if the EU adopts mandatory quotas for each member nation? The answers are contained in a series of graphics and interactives.
Never before have so many people risked their lives to reach Europe by sea. In 2015 alone, over 432,000 migrants and refugees landed on the coasts of southern Europe. That is 50% more than during the entire previous year. According to the UN refugee agency, the exodus is mainly people seeking protection, fleeing the wars in Syria and Afghanistan or Eritrea’s dictatorship.
Within Europe, the number of asylum applications lodged last year (more than 660,000) almost reached the peak recorded during the war in former Yugoslavia.
However, the situation varies greatly from one country to another. Germany might receive an estimated 800,000 asylum applications by the end of the year – four times more than in 2014. Swiss migration officials anticipate 29,000 applicants for 2015, still well below the influx of more than 40,000 in 1991 and again in 1999, as shown in the graph below.
If the Mediterranean has become the main gateway, it is partly because the EU has fortified its southern land borders. Barriers are in place between Morocco and the Spanish enclaves of Ceuta (8 km) and Melilla (12 km); between Turkey and Greece (12.5 km); and between Turkey and Bulgaria (30 km). Their construction cost 77 million euros, according to The Migrant Files, but they have failed to stop the influx of migrants.
Faced with an urgent situation in late summer, European countries have been reacting in a variety of ways to deal with it. Germany has temporarily opened its borders and called for greater solidarity toward migrants. Berlin also has suspended the transfer of Syrian asylum seekers to other European countries, calling into question the Dublin agreement, which calls for the country that first receives an asylum seeker – most often Greece and Italy – to register and welcome the migrants. That’s all the more significant when one takes into account that just last year Germany was the country that sent back the biggest number of migrants, followed by Switzerland.
In the other camp, the Eastern European countries are the most resistant to welcoming migrants. Hungary, which has registered thousands of daily arrivals in recent weeks, first sought to close its borders, and to block the migrants’ movements at the train stations. Slovakia has expressed its willingness to host refugees, provided they are Christians, while Bulgaria has sent its army to patrol the border.
New walls also are rising along the gates of Europe: Hungary is now completing the construction of a 175 km-long barrier along the border with Serbia, while Bulgaria is taking similar measures along its 130 km-long border with Turkey.
Likewise, in Switzerland the rightwing People’s Party proposed sending the army to the borders, while the patriotic and deeply anti-European Ticino League would like to have the border closed with Italy.
These kinds of proposals, which have drawn the condemnation of human rights groups, do not always come from the countries most affected by the influx of migrants, as shown in the following animation.

Confronted by a virtual lottery when it comes to granting asylum, the EU has been searching for some years to find a collective and unified solution to the migration issue.
While Italy and Greece have seen hundreds of new arrivals daily, the preferred final destinations are Germany and Sweden. Determined to continue their journey, migrants often ignore an obligation to register in accordance with the Dublin agreement, sometimes with the consent of the southern European countries that are unable to handle such an influx.
Several countries in the European Union, led by Germany, are emphatically demanding a revision of the Dublin accord to distribute the refugees among member countries. The proposal provides for the introduction of mandatory quotas – which would be set according to GDP, population and unemployment rates – and possible sanctions for countries that do not go along.
Who would the winners and losers be with such a strategy? The following graph shows asylum applications filed in 2014, according to criteria discussed in Brussels.
As the following graph shows, the migrants’ ability to gain protection varies according to their nationality and the asylum practices of the receiving country. Last year, almost half (47%) of the official cases resulted in a positive decision. This is 12% more than in 2013 (*).
Switzerland is one of the European countries with the highest rate of acceptance or at least temporary admission for asylum seekers – at 70.5%, according to Eurostat (**). The country at the top of the list is Bulgaria, at 94.1%, while at the opposite end was Hungary, at 9.4%, where the majority of asylum applicants in 2014 originated from Kosovo, a country considered safe.
While some countries in Europe are struggling to handle the influx of migrants and are seeing rising levels of intolerance, UN refugee agency figures show that 86% of the refugees in the world (12.4 million as of the end of 2014) came from a country in the developing world. Four million Syrians have now sought refuge in neighboring countries. In Lebanon, for example, refugees and asylum seekers now account for as much as one-quarter of the population. This is the highest rate in the world measured by number of inhabitants, and is 12 times more than in Sweden.
The following map shows the total number of asylum seekers and refugees registered by the UN refugee agency, in millions of inhabitants, or by dollar of gross domestic product (***).
Notes
(*) The increase in the acceptance rate is partly due to the profile of asylum seekers, but also to a change in the methodology used by Eurostat. Since 2014, those already registered in other European countries were not included in the so-called “Dublin” cases to prevent an applicant from appearing in the records of more than one country.
(**) Officially, Switzerland says its “protection rate” was 58.3% in 2014. This includes refugees and people admitted provisionally. How to explain the difference with Eurostat, which says the acceptance rate was 70.5%? It is simple. Unlike Eurostat, Switzerland continues to include in its base of calculations both the Dublin cases and the other cases of people whose asylum applications have not yet been examined.
In addition, and in contrast to the EU, in Switzerland the “positive decisions” are exclusively limited to the granting of asylum (25.6% in 2015). The figures for provisional admissions are included in the statistics for negative decisions.
(***) The UN refugee agency statistics, used in this last map, differ from those of Eurostat, which served as the basis for other graphics. Eurostat only considers the number of asylum applications for each reference period, while the UN refugee agency counts the total number of requests that have not yet been processed (some of which were filed prior to 2014).
Editor’s note: This article was first published on July 22 and updated on September 14, 2015.
Translated from the French by John Heilprin

In compliance with the JTI standards
More: SWI swissinfo.ch certified by the Journalism Trust Initiative


You can find an overview of ongoing debates with our journalists here . Please join us!
If you want to start a conversation about a topic raised in this article or want to report factual errors, email us at english@swissinfo.ch.